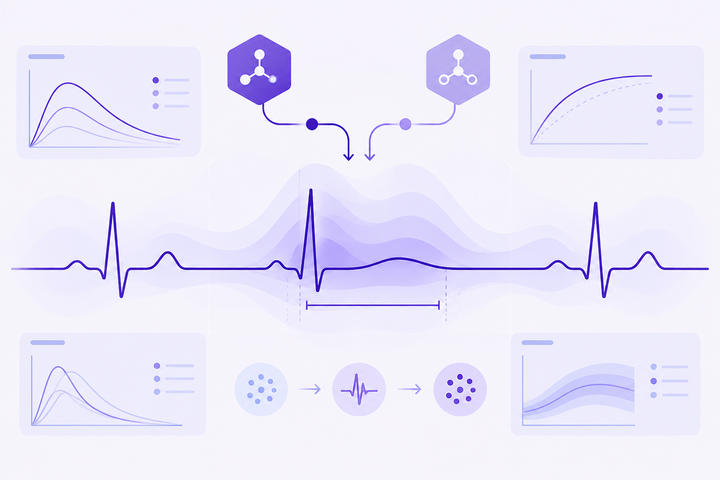
QT prolongation is an electrophysiologic interval descriptor referring to lengthening of ventricular repolarization as represented by the QT interval on an electrocardiogram. Voriconazole-associated QT changes are therefore discussed using electrophysiologic terminology rather than as a standalone pharmacokinetic measurement. Systemic exposure can provide an important contextual layer because drug concentration reflects the combined effects of metabolism, CYP2C19 activity, and overall clearance. Voriconazole also exhibits nonlinear kinetics, which can contribute to variability in concentration-dependent exposure. Temporal persistence can be described through half-life, while peak exposure is characterized by Tmax & Cmax. These pharmacokinetic descriptors provide context for understanding why electrophysiologic measurements may vary across exposure profiles. QT terminology consequently occupies an interface between pharmacokinetics and cardiac electrophysiology, with concentration-time behavior providing one explanatory layer for observed variability and electrocardiographic measurement providing another.
Voriconazole-associated QT observations can be considered within a broader pharmacokinetic framework because systemic concentrations vary according to metabolic activity and drug disposition. Hepatic metabolism involves several CYP pathways, with CYP2C19 contributing substantially to metabolic variability. Interactions affecting CYP activity can modify exposure, including pathway-specific CYP2C19 interactions and CYP3A4 interactions. CYP2C9 interactions represent another metabolic pathway context. Because voriconazole displays nonlinear kinetics, exposure changes may not remain proportional across concentration ranges. Clearance and half-life characterize aspects of systemic disposition, while Tmax & Cmax describe peak-related behavior. These factors create a mechanistic bridge between concentration variability and electrophysiologic observation without reducing QT measurements to any single pharmacokinetic parameter.
Monitoring terminology provides a separate observational layer for describing electrophysiologic and exposure data. ECG monitoring refers to electrocardiographic assessment of cardiac electrical activity, including QT interval measurements, whereas TDM refers to measurement of drug concentrations. The two approaches characterize different domains and can provide complementary information. Pharmacokinetic variability involving CYP2C19, metabolism, clearance, and nonlinear kinetics can alter systemic exposure. Peak concentration and timing are described by Tmax & Cmax, while half-life describes concentration persistence. A separate toxicity overview represents an observational safety domain. Together, these concepts establish a structured vocabulary connecting exposure, electrophysiology, QT interval measurement, pharmacokinetic variability, and monitoring without treating any individual parameter as a complete explanation of cardiac electrical behavior.
The QT interval represents the duration from ventricular depolarization through ventricular repolarization on an electrocardiogram. QT prolongation is therefore an electrophysiologic observation rather than a direct measurement of plasma drug concentration. Voriconazole-associated QT changes can be considered alongside systemic exposure because concentration reflects metabolism, clearance, and distribution processes. Tmax & Cmax describe peak concentration behavior, providing temporal and magnitude-related context for exposure around observed electrophysiologic measurements.
Electrophysiologic variability can arise from differences in cardiac electrical properties as well as differences in systemic drug exposure. Pharmacokinetic factors include CYP2C19 activity, hepatic metabolism, and clearance. Nonlinear kinetics can further complicate the relationship between concentration and exposure because concentration changes may not remain proportional. QT interval terminology therefore describes an electrical observation, while pharmacokinetic terminology explains potential variability in the upstream exposure environment.
ECG monitoring provides electrocardiographic observations that can document QT-related measurements over time. These measurements differ conceptually from TDM, which documents systemic drug concentrations. Half-life provides temporal context for concentration persistence, while Tmax & Cmax describe peak exposure. The toxicity overview domain is distinct again, describing safety-related terminology rather than defining the QT interval itself. Together, these terms provide complementary descriptions of exposure and electrophysiology.
QT Element
Mechanistic Basis
Exposure Interpretation
QT interval
Electrocardiographic interval spanning ventricular depolarization and repolarization
Provides an electrophysiologic measurement
QT prolongation
Lengthening of the measured QT interval
Represents an electrical observation that can be considered alongside exposure
Cmax
Maximum observed systemic concentration
Provides peak-exposure context
Tmax
Time associated with maximum observed concentration
Provides temporal exposure context
Half-life
Time-dependent systemic concentration decline
Provides persistence context for exposure over time
Metabolism, CYP Pathways & QT Variability
Voriconazole undergoes hepatic metabolism through multiple CYP pathways, with CYP2C19 representing a major contributor to interindividual pharmacokinetic variability. Differences in CYP2C19 activity can alter parent-drug biotransformation and systemic exposure. This creates a potential exposure-related context for electrophysiologic observations without making CYP2C19 a direct electrophysiologic mechanism. Clearance integrates systemic drug removal, while half-life describes temporal concentration persistence.
CYP2C19 interactions, CYP3A4 interactions, and CYP2C9 interactions represent distinct mechanisms capable of modifying CYP-mediated disposition. Changes in metabolic activity can alter systemic concentration and thereby change the exposure environment in which electrophysiologic observations are made. Because nonlinear kinetics can produce concentration-dependent disposition, metabolic effects may not translate into proportional concentration changes. QT variability should therefore be distinguished from metabolic variability while recognizing their pharmacokinetic relationship.
Peak concentration provides another exposure dimension relevant to temporal interpretation. Tmax & Cmax describe when peak systemic concentration occurs and how large that peak is, while clearance and half-life describe later disposition. ECG monitoring documents electrophysiologic measurements, whereas TDM documents drug concentrations. These measurement domains can be considered together while retaining their distinct meanings and avoiding the assumption that one pharmacokinetic variable fully explains QT observations.
CYP Pathway
Mechanistic Link
QT Impact
CYP2C19
Major hepatic pathway contributing to voriconazole biotransformation
Can influence systemic exposure relevant to electrophysiologic interpretation
CYP3A4
Additional oxidative metabolic pathway
Can modify exposure through pathway-dependent disposition changes
CYP2C9
Contributes to hepatic voriconazole metabolism
Provides another source of metabolic exposure variability
Voriconazole's nonlinear kinetics means that systemic exposure may not change proportionally across concentration ranges. This characteristic can complicate interpretation of exposure-associated electrophysiologic observations because concentration-dependent disposition can modify the shape and magnitude of the concentration-time profile. Clearance describes overall systemic drug removal, while metabolism describes biochemical transformation. These concepts are related but not interchangeable, and both contribute to the exposure context surrounding QT measurements.
Peak exposure is described through Tmax & Cmax. Tmax identifies the temporal position of the maximum observed concentration, whereas Cmax represents its magnitude. Metabolic variability involving CYP2C19 can influence the concentration profile, while half-life describes later concentration persistence. Because nonlinear disposition can affect concentration-dependent behavior, peak concentration should be interpreted as one point within a dynamic exposure curve rather than as a complete representation of systemic exposure.
The relationship between peak exposure and electrophysiologic observations is therefore multidimensional. ECG monitoring provides electrical measurements, while TDM provides concentration measurements. These data describe different aspects of the same pharmacologic environment. Clearance, half-life, nonlinear kinetics, and Tmax & Cmax characterize exposure behavior, whereas QT terminology characterizes electrophysiology. Their integration supports mechanistic description without equating concentration with an electrophysiologic outcome.
PK Factor
Mechanistic Basis
Electrophysiologic Effect
Nonlinear kinetics
Concentration-dependent pharmacokinetic behavior
Can alter the exposure environment associated with QT observations
Clearance
Overall systemic drug removal
Influences concentration persistence and exposure
Cmax
Maximum observed systemic concentration
Provides peak-exposure context for electrophysiologic measurements
QT-related pharmacology can be described by integrating electrophysiologic measurements with pharmacokinetic exposure data. ECG monitoring documents cardiac electrical measurements, including QT interval observations, while TDM documents circulating drug concentrations. Tmax & Cmax characterize peak exposure, and half-life characterizes concentration persistence. These metrics describe different dimensions of pharmacology and should not be treated as interchangeable measures.
Exposure variability can arise from metabolism, CYP2C19 activity, clearance, and nonlinear kinetics. These factors can alter the concentration-time environment in which electrophysiologic measurements are obtained. The pharmacodynamic component is represented by the observed electrical response, whereas the pharmacokinetic component describes systemic exposure. This distinction allows QT terminology, concentration measurements, and disposition parameters to be integrated without assigning a single mechanism to all observed variability.
A toxicity overview provides a separate terminology layer for documenting adverse-effect concepts and should be distinguished from both QT measurement and pharmacokinetic exposure. ECG monitoring concerns electrical observations, while TDM concerns drug concentration. Tmax & Cmax, half-life, and clearance characterize exposure dynamics. Together, these concepts form an integrated vocabulary for describing voriconazole exposure, electrophysiology, variability, and monitoring.
Monitoring Metric
Mechanistic Connection
Documentation Context
ECG monitoring
Direct observation of cardiac electrical activity
Documents QT interval and related electrophysiologic measurements
TDM
Measurement of systemic voriconazole concentration
Documents empirical drug exposure
Tmax and Cmax
Peak timing and peak concentration
Characterize the peak region of the exposure curve
Half-life
Temporal concentration decline
Documents systemic exposure persistence
Toxicity terminology
Classification of observed safety-related effects
Provides a separate observational domain from QT and PK metrics
Frequently Asked Questions
The QT interval is an electrocardiographic measurement representing the period from ventricular depolarization through ventricular repolarization. QT prolongation refers to a measured lengthening of this interval. The QT interval is an electrophysiologic descriptor rather than a plasma drug concentration measurement. Its interpretation belongs to cardiac electrical physiology, while pharmacokinetic parameters such as concentration, clearance, and half-life describe drug exposure. These domains can be considered together without treating them as interchangeable measurements.
Electrophysiologic measurements can vary because cardiac electrical properties and systemic drug exposure are influenced by multiple factors. In the context of voriconazole, pharmacokinetic variability may involve metabolism, CYP2C19 activity, clearance, and concentration-dependent disposition. The resulting exposure environment can differ between pharmacokinetic conditions, while the electrical measurement itself remains an electrophysiologic observation. Therefore, variability in a QT-related measurement should not automatically be attributed to one pharmacokinetic parameter or one metabolic pathway.
CYP metabolism can influence QT observations indirectly by modifying systemic voriconazole exposure. CYP2C19 is an important metabolic pathway, while other CYP enzymes also contribute to disposition. Differences in metabolic activity can alter circulating concentrations, creating different exposure environments in which electrophysiologic measurements are obtained. However, CYP activity is a pharmacokinetic mechanism rather than a direct definition of QT physiology. QT observations therefore represent a separate electrophysiologic domain that can be interpreted alongside, but not equated with, metabolic data.
Nonlinear kinetics matters because voriconazole exposure may not change proportionally across concentration ranges. Concentration-dependent disposition can modify the relationship between systemic input, circulating concentration, and clearance. When electrophysiologic measurements are considered alongside exposure data, this means that a change in one pharmacokinetic variable may not produce a predictable proportional change in concentration. Nonlinear kinetics therefore adds complexity to exposure interpretation and reinforces the distinction between pharmacokinetic concentration measurements and electrophysiologic observations such as QT interval duration.
Peak concentration is represented by Cmax, while Tmax identifies the time at which that maximum concentration occurs. Together, these metrics describe the magnitude and temporal position of peak systemic exposure. For voriconazole, peak behavior can be influenced by absorption, distribution, metabolism, CYP2C19 activity, and nonlinear disposition. Peak concentration is therefore one feature of a larger concentration-time profile. It provides exposure context but does not independently define total exposure, pharmacodynamic response, or electrophysiologic outcome.
ECG monitoring refers to electrocardiographic assessment of cardiac electrical activity, including measurements related to the QT interval. TDM, or therapeutic drug monitoring, refers to measurement of systemic drug concentrations. These approaches describe different domains: ECG monitoring documents electrophysiology, while TDM documents pharmacokinetic exposure. For voriconazole, concentration data can be considered alongside metabolic and disposition variables, while ECG measurements characterize electrical observations. Neither terminology is synonymous with the other, and each provides distinct information within an integrated pharmacologic framework.